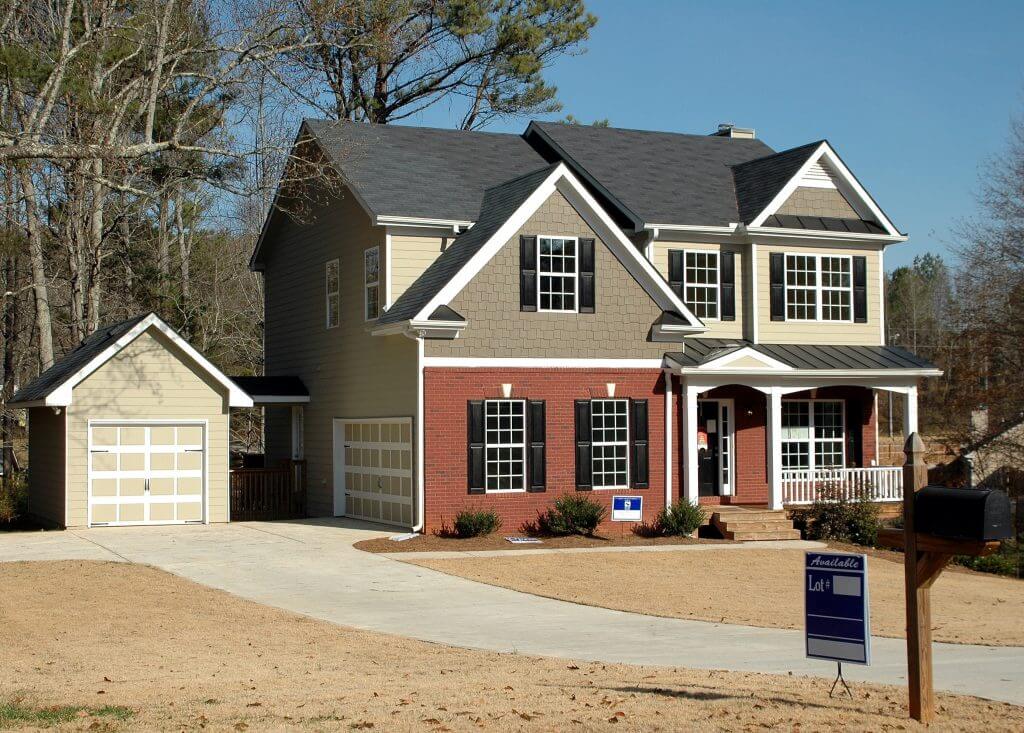
“There’s no place like home, there’s no place like home, there’s no place like home.” – Dorothy, The Wizard of Oz
“Manic Housing Market Needs a Calming Dose of Deregulation”. So headlined Bloomberg on June 1st. “An inflation storm is coming for the U.S. housing market.” Thus warned Marketwatch on June 26th. By now, most of us are aware that residential home prices are, and have been, heading higher, with the median sales price in May reaching $374,400 versus $317,100 a year earlier. Employing our recollection of Economics 101 many of us would assume rising prices are a result of higher demand. That would not be correct. Mortgage applications for new home purchases are at their lowest level since May 8th, 2020 and are down 20% from the end of last year. So, if rising demand does not explain rising prices, then it must be shrinking supply. Well, no. Supply is actually rising. The supply of existing homes for sale is at 5.1 months, a 50% increase since September of last year. Housing starts in May were 1, 572,000 versus an average rate of 1,200,000 in the three pre-pandemic years of 2017 to 2019.
Looking at median home prices on an inflation adjusted basis is perhaps the best way to understand just how extraordinary the rise in housing prices has been. At the start of 1960 it was $174,079, in 1980 $187,505 and 2000 $206,620. The low in the past ten years was February 2012’s $198,688. With the $374,400 figure for May home buyers are now paying 88% more than just over nine years previously. This may serve to explain the headline of a story posted by Reuters on June 23rd “U.S. new home sales tumble to one-year low as prices soar.” It may also explain the polar opposite perspectives of home builders and home buyers. A confidence index for homebuilders is at 81.0, down slightly from 90 in March but still at a thirty year high. Homebuyer’s though feel somewhat differently. At 74.0 it contrasts dramatically with the 108.0 in March of last year which had marked the prior thirty year low. So, to summarize, prices are at historical highs, demand is falling and supply is rising. Wondering which direction home prices may be heading?
Wishing to perpetuate our housing tale just a bit further, equity market investors may have felt they were holding a “full house”. The last five days of June saw consecutive rising prices. The month was the fifth in a row with higher prices and the 8.2% return for the S&P in Q2 was the fifth straight quarter with over 5% gains, the first time that has occurred since 1945! In the race towards new highs though, the market did exhibit signs of fatigue in June. Foreign developed markets were down 1%. Emerging markets were up 1%, small cap stocks +1/3% and mid cap stocks -1%. Five of the eleven S&P equity sectors were negative and Technology regained its leadership role rising 6.9%.
The leadership of the market had rotated last November favoring small cap stocks, value over growth and foreign performing in line with domestic. In March that leadership began to revert back to its prior sources and that is exhibited in the Q2 rates of return. The S&P returned 8.4% with mid cap +3.5% and small cap +4.3%. S&P value stocks are still outperforming growth stocks year to date 16.3% versus 14.3% but with growth’s +11.8% return for Q2 versus value’s +4.9% that gap has significantly narrowed. The year to date rise in interest rates was entirely contained in Q1 with AGG, a widely used index of returns on taxable investment grade bonds, +.83 for June, +1.77% for Q2 and -1.66% year to date. For 60/40 portfolios returns were 4% for the quarter and are now 8.6% year to date.
Mark H. Tekamp/July 6, 2021