Running With the Bulls

”There comes a time in the affairs of man when he must take the bull by the tail and face the situation.”
WC Fields

Providing substance to the thesis that many investment prognosticators would rather be right than rich, the financial press’s take on 2023 was surprisingly curmudgeonly. The Wall Street Journal, in its December 30 edition, headlined “What Did Wall Street Get Right About Markets This Year? Not Much”. Barrons, in its January 1st edition, bemoaned the S&P 500’s inability to close at an all-time high headlining “The Stock Market Saved Its Biggest Disappointment for the Last Day of the Year” taking a rather grinch like view of the indices 24.2% return for the year while reminding readers that 2023 was the first year since 2012 that the index had failed to make at least one record high during the year.

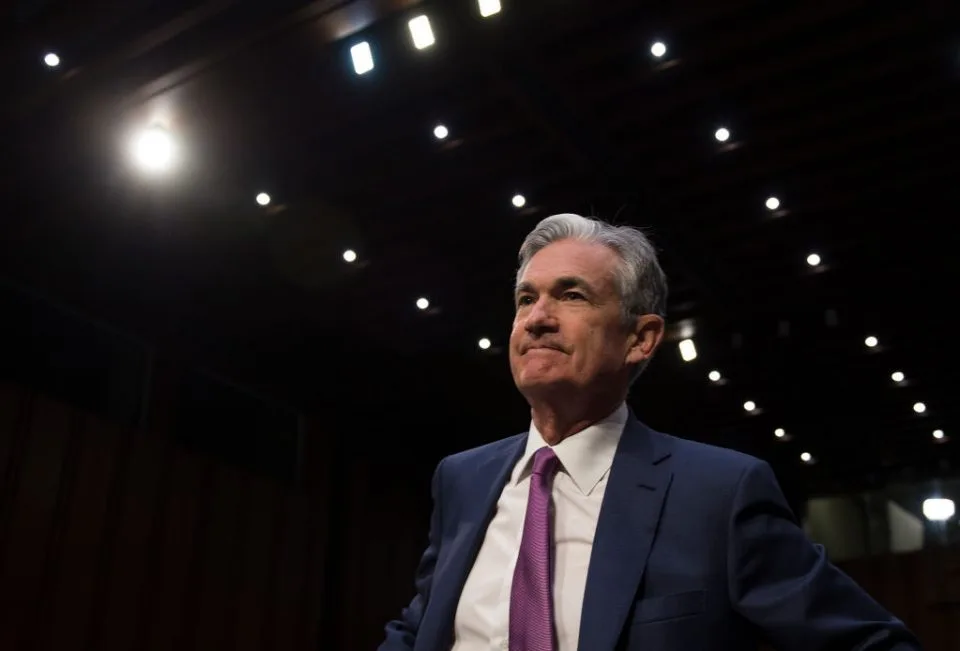
Stock market investors new best friend, Federal Reserve Chairman Jay Powell, was having none of the punditry’s proclivity towards negativity as he offered the promise of what every investor had at the top of their shopping list, lower interest rates! At the chairman’s press conference on December 13th, he spoke words that got stocks hot ‘round the world “if the economy evolves as projected, the …appropriate level of the federal funds rate will be 4.6% at the end of 2024…” There! He said it! Rate reductions of ¾ of a percent next year! From the moment those words left the chairman’s mouth at 2 pm that day to the market close two hours later the Russell 2000, an index of small US companies, rose 4%.

Could it be that markets are starting to “sniff out” something missed by almost all of those ophthalmologically challenged market commentators? A perusal of the data the Fed releases at the conclusion of its meetings reveals that the Fed expects US economic growth to decline from 2.6% in 2023 to next year’s 1.4%, a near 50% deceleration of expected growth in the economy and materially below the 2% rate widely considered “normal”. Those numbers also reveal the Fed expects inflation levels to decline further next year to 2.4%, very close to the Fed’s inflation target. Economists dispute the exact level of interest rate which neither contributes to nor detracts from economic growth rates, but opinions tend to gravitate towards ½% above the rate of inflation. Simple arithmetic is the 2.4% expected rate of inflation + ½% neutral rate of interest equals 2.9%, versus the current Fed Funds rate of 5.5%, offers the prospect of 2.6% possible rate reductions next year. This may be the true source of the sweet aroma wafting upwards past the nostrils of stock market bulls. It may also be that the truly contrarian call for 2024 is for investors to ask themselves “as bullish as you are, are you bullish enough?”.

As we prepare to cast this fed rate tightening cycle into history let’s take a look at an explanation for it resting on the possible existence of ulterior motives, while acknowledging the reality of the near to total misalignment of its cited cause and actual effect. We’re not cynics but are fond of the phrase “cui bono” (who benefits). If the objective that exceeds all others in order of importance is the maintenance of the solvency of the United States government, and if the key measure of that solvency is the outstanding market value of US Federal debt in relation to the nominal (non-inflation adjusted) value of the US economy, then perhaps we have a useful starting point. In the ten years ending 2019 US nominal GDP grew at a 4.1% annual rate. In the three years from Q3 2020 through Q3 2023, due to the higher rate of inflation, that rate rose to 6.3%. With the rise of interest rates the market value of previously issued Federal debt declined in value. On January 1, 2022, the outstanding market value of US Treasury debt was $23.4 trillion. From January 1, 2022, through November 30, 2023, the US Treasury issued $3.9 trillion of additional debt but as of November 30, 2023, the market value of that debt had risen by “only” $765 billion meaning that 80% of the value of the “new” debt was offset by the losses experienced by the holders of the “old” debt. Whether this confluence of circumstances was coincidental or not, it did allow the United States Treasury to issue trillions of dollars of new debt while achieving the remarkable outcome of the outstanding balance of US Treasury debt remaining stable as a share of US GDP from 2019 through Q3 2023. Cui bono?
S&P Dow Jones Indices, in their recapitulation of the 2023 market, remained focused on the Magnificent Seven stocks, AI and info tech but that is starting to acquire the feel of yesterday’s story as small cap stocks 12.8% returns for December notably outperformed the 4.5% return of the 500, value outperformed growth, real estate’s 8.7% exceeding info tech’s 3.8% and even foreign developed markets 6% outperforming. The fixed income tortoise finally caught up with the equity hare as 60/40 portfolios returned 13.8% for the year with the equity share returning 22.35% for the year and fixed income eking out a miserly 1% but the tortoise did awaken returning 6.875% versus equities 11.5% for the quarter and 4.875% versus equities 5.50% for the month with the portfolio providing overall returns of 8.75% for the quarter and 5.25% for the month. 60/40 portfolio investors longing for the day when they recapture the remainder of their 2022 losses may not have to wait very much longer as they are now but a modest 4 ½% away.

December 30, 2023/Mark H. Tekamp

Foller the Dollar

”I found a dollar the other day, it lay there on the ground; I wondered who had dropped it, and I had to look around…”
The Value of a Dollar Poem; Janice M. Pickett

CNBC headlined its story of the stock market’s final trading day of November “Dow jumps 500 points to new 2023 high Thursday capping 8% November rally”. Though only separated by a single month, October seemed recast as an occupant of an alternative reality as that month’s unwelcome tricks were thankfully subsumed by November’s treats. The S&P 500 returned 9.1% for the month and is now up 20.8% for the year. Unlike every other month since February this was a party to which all sectors of the financial markets were invited as mid-cap stocks were up 8.5%, small cap stocks 8.3% and foreign developed markets 9.6%. Even the previously woebegone bond market participated as ten-year treasury rates declined by half a percent to 4.4% allowing the majority of fixed income securities to migrate from negative to positive returns year to date albeit with most sectors of that universe providing modest returns in the low single digits.

The source of the sudden turn in fortune for the financial markets is to be found where it almost always is these days, in the words from arguably one of the most famous men on the planet, US Federal Reserve Chairman Jerome Powell. At the press conference on November 1st, following the fed’s two day meeting, it wasn’t so much what he said, that the fed had opted not to raise interest rates which was not really news since no one expected that to happen anyway, but rather that the fed had chosen to hold interest rates at current levels to allow it to determine whether rates had risen to a sufficient level to permit it to claim the accomplishment of its mission of pushing inflation back down to its 2% target. Attempting to square the circle of the sizzling 5.2% annualized inflation adjusted economic growth rate for the 3rd quarter with a rapidly declining inflation rate, the chairman essentially said that since he didn’t know what to do, he would opt to do nothing.

Like so much of our current perceived state of reality, the proper correlation of causes and effects appears to be a form of art increasingly served rarely. Let it be offered as a suggestion that the market that is the most important one is that which establishes the value of the US dollar. The reason why is the existence of the two numbers that matter most; global debt which is $300 trillion and the size of the global economy which is $100 trillion. As global debt has grown at a rate notably faster than that of the global economy for the past several decades, the world has lost its ability to retire that debt and therefore must continually refinance it. In other words, to “roll it over” in a fashion much like the extending of the terms of the maturity on an interest only mortgage. Since the Global Financial Crisis of 2008, the money that is borrowed to pay off current debt through the issuance of new debt is required to be collateralized; the borrowers’ use of securities as a means of guaranteeing their ability to repay their debt. Though the US represents only a quarter of the world’s economy, 70% of global debt is financed using the US dollar and the preferred form of collateral to support the issuance of that debt is US Treasury securities. The global financial system has become a debt-based system dependent upon the ever-increasing supply of US Treasury debt and that, dear reader, is the reason why the US dollar has assumed the role of the financial market dog wagging the equity market tail.

As the US Federal Reserve has raised interest rates from ¼ % in March 2022 to 5 ¼% currently, the result has been to increase the flow of foreign capital into US dollar-based assets resulting in an increase in demand for dollars and an increase in its value. This matters because a more expensive dollar makes it more expensive to “roll over” the global debt mountain. From March 1, 2022, to September 27, 2022, the US dollar rose 17.3% and the S&P 500’s declined 14.5%. From October 5, 2022, through August 1, 2023, the US dollar declined 8.2% and the S&P 500’s rose 22.6%. Since October 28th the US dollar has declined 3.2% and the S&P 500 has risen 11.8%. So, what should investors now expect from these markets? The growth of US budget deficits, which has been the source of much of the US economy’s surprising strength this past year, is now starting to wane. US inflation levels may quite possibly undershoot the fed’s 2% target. This is what the financial markets rally in November is starting to “sniff out”. US equity markets, excluding the mega cap tech stocks, haven’t done particularly well the past two years leaving midcap stocks currently valued at 13.6 and small cap stocks 13 times 2024’s expected earnings. Even the equally weighted version of the S&P 500 is trading at 15 ½ times this year’s earnings. With reasonable valuations, falling inflation and declining interest rates we may quite possibly be setting ourselves up for some very interesting times.

For 60% equity and 40% fixed income investors the onset of the year through the end of Octobers was all about a great deal of motion with little in the way of forward progress. November’s portfolio returns of 6% received contributions of 9% from the equity share with fixed income contributing 1.5%. The equity contributions were relatively evenly distributed with large cap and small cap US and foreign returning between 8% and 9%. Year to date portfolio returns are now at 8.2%.

Mark H. Tekamp/December 6, 2023

The Great Rate Abate

”What is easiest to see is often overlooked”. – Milton H. Erickson

After two years, could it have been for the entirety of that time that it really was so simple? Recollecting how many thousands of words have been written debating the prospects for economic recession, inflation rising or falling and the prospects for a notable decline in the stock market due to falling corporate profits, one is struck by how many false paths have been followed. Could it be that the entire time we were gazing into our crystal balls attempting to divine the future, what we were most fearful of was what was being experienced? What if the bear market we were so afraid of experiencing these past two years, due to our need to navigate our way through an aggressive Federal Reserve rate tightening cycle, is not something we need fear as part of our future but is now part of our past?

From January 1, 2021, through May 31, 2022, the consumer price index had risen at a 9% annualized rate in those seventeen months with 10-year US Treasury rates tripling from .93% to 2.85%. From June 1, 2022, through October 31, 2023, the annualized rate of inflation has fallen to 2.6% but with Treasury rates continuing their rise to 4.88%. In the past two years through October 31, 2023, the two-year total return of the S&P 500 of -5.95% obscures the true state of negativity of the financial markets. 60% equity & 40% fixed income portfolios have declined 15.64%. The version of the S&P 500 with each stock in that index equally weighted has declined 13.9% and the S&P 600, an index of US small cap stocks, has fallen 18.6%. The price of the average investment grade taxable bond in the United States has declined 15.4%. Of the major asset classes only gold and commodities have provided investors with positive returns.

With Jay Powell preparing to take his victory lap for having placed the inflation genie back in its bottle, it might be interesting if we were to pause to consider the strength of the correlation between the falling inflation rate and the timing of the fed rate increases, which began in March 2022. Three months after that first rate increase, the inflation rate reached its peak in June 2022, although the fed had only raised interest rates by 1.5%, or less than one-third of the total of the 5% increases from March 2022 to its most recent increase on July 25th of this year. Energy prices had risen by 70% from October 2021 to June 2022. Since then, they have fallen 34%. Is that the fed’s rate increases or geopolitics? What about all of the press conferences in which Jay Powell stated that inflation was unlikely to fall to acceptable levels without a slowdown in the rate of economic growth? If this was true, then why has the rate of inflation fallen so significantly while the inflation adjusted rate of US economic growth has risen from 1.8% in the year ending October 2022 to 2.95% this past year? Perhaps the greatest mystery has been why so many of the American people have either been convinced, or perhaps convinced themselves, that the pain of higher interest rates has been in any way contributory to the return of the rate of inflation to close to its pre-pandemic levels.

Let’s be clear that the Federal Reserve is responsible for setting the Federal Funds rate, an interest rate establishing the cost of overnight borrowing, NOT the interest rate on 10-year US Treasury bonds which is set by the supply and demand for those securities in the financial markets. Nonetheless, it is quite plausible to suggest that the increase in short-term interest rates has been a significant contributor to the rise in the 10-year treasury borrowing rate. It is also a simple matter to establish that the behavior of interest rates have been the single greatest contributor to the return, or lack thereof, of the equity markets. From April 1, 2021, through December 31, 2021, the interest rate on ten-year treasuries declined from 1.72% to 1.52% and the S&P 500 rose 19.8%. From October 1, 2022, through July 15, 2023, the ten-year treasury rate remained unchanged at 1.74% and the S&P rose 27.4%. The correlation is obvious and should provide a great deal of hope to investors in the financial markets. If the Federal Reserve is responsible for the raising of interest rates and the Federal Reserve is done raising interest rates AND equity markets only need stable if not declining interest rates to move to higher levels, then perhaps it is time to prepare for the possibility of much better times for investors in the not very far distant future.

60% equity & 40% fixed income portfolios returned -2.35% in October and are now up a miserly 1.48% for the year. The S&P 500 was -2.10% for the month though up 10.7% year to date. Mid-cap and small-cap stocks were both down over 5% in the month and both now show negative returns for the year with mid-cap stocks -1.30% and small-cap -5%. Foreign developed markets were -3.5% for the month but still +3% for the year. The story of the equity market year to date remains frustratingly consistent; a stock market that continues to rise on the backs of eight single companies; Alphabet (Google), Amazon, Apple, Meta (Facebook), Microsoft, Netflix, Nvidia and Tesla. Netflix is the worst performing of the eight returning 39.6% and NVIDIA the best returning 179%. The eight companies now represent just under 50% of the S&P 500 Growth Index which explains that indices 15.26% return year to date though down notably from its return of 26% on July 28th.

Mark H. Tekamp/November 7, 2023

Strive for Five!

Best things dwell out of sight, The pearl, the just – our thoughts. Most shun the public, are legitimate and rare. “Best Things dwell Out of Sight” – Emily Dickinson

The Wall Street Journal of September 29th treated its readers with a pair of kid gloves headlining its article describing the performance of that month’s equity markets “Stock-Market Rally Sputters in New World of Soaring Bond Yields” as the months -4.8% return transformed the 3rd quarter’s return to a -3.3% and applying a haircut to its year to date return reducing that figure to +13.1%. S&P Dow Jones, in its commentary of the month’s market, chose to describe it as a market rally that “fizzled,” citing 10-year Treasury yields rising to 15-year highs, renewed inflation concerns and worries about the Fed’s “hawkish” guidance. Talk of “soft landings” seemingly went AWOL amid increasing references to the possibility of “crashes” and some market commentators citing what they perceive as parallels between current market conditions and those preceding the market conditions of 2008-2009. Proving that fear can be contagious, the needle of the CNN Fear & Greed Index now finds itself residing in the Extreme Fear space.

A consumer of commentaries on the economy and financial markets should be struck by the increasing length to which those commentators are going to find evidence to support their narratives. Demography, one of the longest term of variables, is cited to support the thesis that inflation is likely to remain higher for longer. Federal budget deficits, which have been large for a long time, are now at a crisis point. Another reason for the likely persistence of inflation is that the US workforce has grown militant and increasingly prone to demand very high wage increases though only 10% of the US workforce is unionized. Another source of worry is that those same workers that are demanding significantly higher wages, as they spend down their pandemic sourced savings accounts, are viewed by some as increasingly likely to default on their credit card debt and sink under the burden of their renewed student loan payment obligations. What they do not include in their narratives is that those same households’ cost of servicing those debts, in relation to their income, is below that of any year in the past thirty-four years. And US corporations, which are claimed by some to be about to buckle under their need to refinance their debt at today’s much higher rates, are currently able to service those same debts at a cost that, in relation to our national economy, is at its lowest share in more than forty years and 40% lower than four years ago. Perhaps the greatest surprise for those willing to step outside the realm of opinion into that of fact is how stable this year’s economic environment is with a great many of the various indicators used to measure the current state of our national economic well being represented by close to horizontal lines; in other words, our national economy is very much in “steady as she goes” mode.

Why bother with the financial markets, the beleaguered investor may be forgiven for asking. 60 (equity)/40 (fixed income) moderate investment portfolios have created negative returns in the past twenty-four months. The losses aren’t large, likely near 6%, but why not just step over to the sidelines and roll over six-month Treasury bills paying 5 ½% with NO risk? No need to worry about inflation, recession, government shutdowns budget deficits etc. Once things “look” better, say after the presidential election next year, one can always get back into the market and experience the better days to come. This seems like such a sound proposition it is tempting to view its logic as very close to compelling. History though may offer a counter argument. We are either at or very close to the end of this rate hiking cycle; the seventh since 1984. In the prior six episodes the S&P 500 returned ON AVERAGE 20% in the succeeding twelve-month period. Market declines are the price investors pay to be in the stock market. Perhaps the price is close to having been paid. Perhaps the greater risk is missing the reward. Recent market behavior provides additional evidence to support the possible wisdom of not exiting this market. Call options are a “wager” on higher stock market prices and put options are their opposite. Negative wagers on this market are currently at the highest levels since two prior times this past twelve months. This first time, December 19th of 2022 the market was 10% higher on February 2nd. On March 8th the market was 15 ½% higher on July 28th.

Q3 2023 provided investors with something they had not experienced in the year’s first half, with the fixed income portion of the portfolio outperforming that of the equity. This was partially attributable to the equity market’s overall decline of 3% in the quarter. The fixed income share though, experienced modestly positive returns of 1.5% leaving 60/40 portfolios -2% for the quarter and +4.6% year to date. Equity markets in the quarter offered investors little in the way of safe harbors as most equity holdings created returns of between -2% and -4% with small cap stocks underperforming a bit more. The relatively good behavior of fixed income during the quarter was attributable to interest rates rising in the intermediate to longer term maturity range but shorter-term maturities remaining relatively constant allowing investors to earn their cash flow without declines in the value of their principal.

Mark H. Tekamp/October 7, 2023

Bytes, Apple & the Atom

When the woman saw that the tree was good for food, and that it was a delight to the eyes, and that the tree was desirable to
make one wise, she took from its fruit and ate; and she gave also to her husband with her, and he ate. Genesis 3:6

The news of the final trading day of August, if it was news, decidedly didn’t seem particularly “new”. “Morgan Stanley analyst predicts S&P 500 could leap another 11% this year boosted by “Magnificent Seven” stocks”. So opined Fortune. Apple Ends Historic Winning Streat. The i Phone 15 can’t come soon enough” from Barrons. And finally, from MarketWatch, “Alphabet Inc. Cl A stock outperforms market on strong trading day”. The hottest month of the year didn’t exactly warm up the financial markets but, perhaps anticipating autumn, it certainly did bathe them in a sea of red. S&P Dow Jones publishes a collection of sixty indices at the end of each month. Of the sixty fifty were red with the thirty covering the domestic stock market containing only three not of that hue. For the S&P 500 it might have been worse as the index was down 4.7% by the 17th prior to rallying 3.1% to finish down 1.6% for the month. The negativity was more pronounced everywhere else as small cap stocks slid 4.1%, midcap stocks 2.8%, foreign developed markets 3.7% and emerging markets 4.4%. Ten-year US Treasury rates starting the month at 3.97% hit a peak of 4.34% on the 21st finishing the month at 4.12%.

The most pronounced sound for those listening to the financial markets may have been that of the towels being tossed in by those market observers harboring opinions bordering the optimistic on the economy or the financial markets. The recession, though deferred, is most certainly coming. Inflation, though indisputably lower, may soon reverse course though that may not matter since Jay Powell seems determined to throw the rocks of higher interest rates until something breaks. The stock market is certainly overvalued, and US federal finances are in a state not too far distant from the catastrophic. Rather than seeking to speak truth to the market though, perhaps it might prove to be more profitable listening to what it is saying. Homebuilding stocks are up 20.6% in the past three months, more than twice the S&P 500’s 8.3%. The returns on those stocks most sensitive to the rate of economic growth are now outperforming those stocks least sensitive to it at a rate that is at ten-year highs. Finally, one of the best contrarian indicators has proven to be the rate of change at which investment strategists are lowering their price targets for the stock market. Century to date those levels have only been exceeded in 2003 and 2009, years AFTER major bear markets. What’s not to love?

Peter Thiel is famous for having said “you can invest in companies that deal in bits or you can invest in companies that deal in atoms.” This was his exhortation to invest in companies that are asset light and knowledge intensive (technology) rather than those that are asset heavy and make stuff composed of atoms (industrials). Certainly, those who took his advice when he spoke those words in 2014 have been well rewarded. In 1997 the services share of the economy was 80% larger than that of the industrial. Today it is 170%. Interestingly though, there are a collection of businesses that exist within the Industry sector of the stock market whose returns have nearly doubled at 260% the 131% return of the Information Technology sector in the past five years. Companies composing that industry such as WillScot Mobile, MYR Group, IES Holdings and Primoris Services are not exactly household names. The companies we are discussing are in the Construction & Engineering business.

Could it be that our economy is migrating to a new era in which the rewards are earned disproportionately by those companies which make rather than break things? A not small part of the story here is that the industrial part of our economy has now reached a size where even modest shifts in favor of the industrial part of our national economy represent very large changes in revenue and earnings for companies that are just not that large. WillScot Mobile (WSC) for instance had revenues in the second quarter of $582 million versus Apple’s $81.80 billion, with the latter company’s market capitalization of $2.93 trillion exceeding that of the former’s $8.092 billion, making Apple 362 times more valuable. Finally, the Bureau of Labor Statistics (BLS) employment growth forecast for the period 2021 to 2031 is interesting with the five greatest expected growth rates being Support Activities for Mining, Electrical Equipment & Component Manufacturing, Power & Communication Lines & Related Structures, Utility System Construction and Building Construction.

As mentioned above, for investors August was a veritable sea of red but it might have been, and actually was intra month worse, as 60/40 equity/fixed income portfolios finished down for the month 2.6% but better by 2% than their levels on the 17th of the month. Only equity investors holding concentrated exposure to energy stocks saw green while everything else wasn’t. The equity share of portfolios, though down 2.6% for the month, is still showing handsome returns of +14.6% year to date. Fixed income though continues to lag as higher interest rates percolate their way throughout the yield curve creating negative returns of 2% for the month and -4.5% for the year leaving portfolios with returns of 7 ½% year to date.

Mark H. Tekamp/September 2, 2023

Fine Without China?

The sun sets behind the mountains and the Yellow River flows into the sea;

To thoroughly enjoy a thousand mile sight, climb up another level – “Climbing Stork Tower” – Wang Zhihuan

August 1st’s Wall Street Journal’s celebration of July’s stock market rise headlined “S&P 500 Extends Winning Streak to Fifth Month of Gains” was subdued with another story that day cautioning “Earnings Season Threatens Lofty Stocks. The Benefit of Owning Stocks Over Bonds Keeps Shrinking”. Indeed, though concerns about imminent recession and persistent and elevated inflation have continued to fade, there is also the reality of longer-term interest rates rising, a 14% increase in oil prices and the US Treasury’s announcement on July 31st of its plans to borrow in excess of $1 trillion dollars in the 3rd quarter. Issues that offer questions with uncertain answers.
The writer of this commentary proposes to discuss the influence of China in the life of the US economy and financial markets in less than one page, seeking to accomplish an objective that others have sought to achieve through a much more profligate use of words. The reason is that it is becoming increasingly apparent that the imbalances of the relationship between the two countries have now reached such extreme levels that the time of their reversal has grown near. That poses the prospect of dramatic change as well as challenges for the global economic and financial markets over the next ten years. So, it may well be wise for us to expend the effort to understand these changes and challenges; an effort we will attempt to accomplish through our exploration of four specific topics.

First is that while China’s and the US’s economies have a profound influence upon one another, they are in no way similar. The foundation of our economic system rests upon the employment of capital where it is possible for it to earn the highest rate of return. China’s economic system, in contrast, can best be described as a communal form which seeks the highest level of output through the full utilization of employment and other resources. This explains what is often referred to as “the hollowing out” of our economy as much of our economic capacity has migrated to China and its much lower costs of production. This is reflected by investment representing 43% of China’s economy versus 21% of our own, with personal consumption composing 68% of the US economy versus 38% of China’s.

Why this matters (point #2) is because China’s trade surplus with this country, $383 billion in 2022, is financed through its employment of debt which, since the global financial crisis of 2008, has grown at a rate much faster than its economy. While its total debt in relation to the size of its economy is half that of the US, our economy, when measured on a per-capita basis, is six times greater. This means that China’s ability to service that debt is one-third of that of our own. The global economic system must ultimately balance and so China’s trade surplus is the mirror image of US federal budget deficit, which now exceed the size of the US economy for the first time since World War Two. As the economist Herb Stein posited in 1986, “if something cannot go on forever, it will stop.”

Point #3. In 2000 China represented 7 ¼% of the global economy. It is now 18 ½% with that country the source of one-third of global economic growth the past forty years. It is the producer of 60% of the world’s cement, 50% of its steel and is the consumer of more than 50% of its aluminum, coal and iron ore. As a significant share of the world’s manufacturing capacity migrated to China, the cost of manufactured goods declined, leading to lower levels of inflation, falling interest rates and rising levels of global debt. Much of China’s trade surplus with the United States, and its resulting accumulation of US dollars, was recycled back to the United States through its purchase of US treasury securities, freeing up capital in this country for employment in the financial markets, explaining at least in part, the long running bull market in US equities.
Our final point is that the current geopolitical tensions between the United States and China should perhaps be understood as an effect rather than a cause. The two countries are destined to “decouple” from one another, not entirely but to a significant extent, because, quite literally, we can no longer afford one another. Each will go its own way and that, in the economic and financial sense, changes everything.

The July stock market was a dispenser of equal opportunities as the share of the market participating in the recent uptrend broadened significantly with the 5.5% rise in small cap and 4.1% in mid cap exceeding the 3.2% of the S&P 500. The value share of the S&P 500 returned 3.4% versus 3% for the growth, and energy stocks’ 7.3% return notably outpacing technology’s 2.6%. 60/40 portfolios returned 3% for the month with the slightly negative returns on the fixed income 40% pulling down the 3 ½% contribution of the equity 60%, leaving portfolio returns at 10% year to date.

Mark H. Tekamp/August 6, 2023

The Recent Past Won’t Last

Yesterday is a mystery-where it is today; While we shrewdly speculate flutter both away

Emil Dickinson – “Yesterday is History”

“Market Monster 2023 Rally Defied All Expectations” read the headline in the July 1st Wall Street Journal. “Stocks burst out of a bear market with the Nasdaq Composite up 32% posting its best first half of the year since the 1980’s” began the story. Interestingly, 2023’s first half return for the S&P 500 of 15.9% places it as tenth best in the years since 1951 serving as a counterpoint of 2022’s -15.6% as the third worst. (note that these are “price only” returns and do not include returns attributable to dividends). While technology stocks continue to grab the headlines Carnival Cruise Lines was the month’s best performing stock returning 67.7% for the month and 133.6% for the year with Delta Airlines the fifth best up 30.9% and 44.7% respectively. Providing further evidence of the notable broadening out of the market in June was the outperformance of small cap and midcap stocks returning 8% and 9% respectively versus the S&P 500’s 6 ½%. For those keeping score the S&P 500 is now just 6% from reaching its all-time high of January 3rd of last year.

With the rising temperatures of summer seemingly having sent the bear population back into hibernation perhaps it might be helpful to recognize the existence of some creeping shadows whose outlines are becoming visible. While not necessarily having a significant impact on our economy until next year we should not forget that equity markets tend to begin to discount such events approximately six months prior to their actual appearance. In the interests of brevity, we’ll focus upon just three; mortgage and student loan payments, the downward migration of the number of job openings in relation to job applicants and the coming depletion of the surplus savings of the US population.

The market for single family homes in the US is composed primarily of the resale of existing homes as that volume exceeds the purchase of new homes by a factor of seven to one. The average mortgage payment in this country is $1672 and most of those are fixed at rates of between 3% and 5%. At current interest rates the average payment is now $2300. Homeowners have been loath to sell their homes as evidenced by a near 20% decline in the volume of existing home sales year over year which has acted to support housing prices. The decision to move though, in most instances, is one that can be deferred but not postponed. Gradually, owners will sell, buyers will buy, housing prices will adjust downwards and increasing numbers of households will be faced with notably higher monthly mortgage payments. Add to this the US Supreme Court’s ruling on June 27th that 42.3 million Americans who have enjoyed three years of forbearance on making payments on their $1.6 trillion in student loans will need to start making payments in October on those loans averaging $275 month.

Investors stepped into 2023 being continuously reminded, by almost everyone with an opinion on the subject, of the inevitability of the coming recession. This year is now half over, and an increasing share of those prognosticators have come to believe that our national economy may slow but will continue to, at worst, muddle along. A significant likely contributing cause to our having avoided more challenging economic circumstances is the $2.6 trillion we received, primarily from the federal government, for pandemic relief. We’ve spent that down to $1.2 trillion as of April and, at the current rate of their depletion, household savings will be back to their pre-pandemic levels in just about a year.

Finally, many have been struck by the plethora of “help wanted” signs just about everywhere one is able to spend their money, as prominent as American flags at a 4th of July parade. This is a significant contrast to the first eighteen years of the 21st century when those seeking work outnumbered the jobs they were seeking. That started to change even prior to the pandemic but by the onset of 2021 job openings outnumbered those seeking them by over two to one. Currently we’re at 1.6 with that rate heading steadily lower. With that rate still elevated, workers losing jobs can easily find another so the slowdown in the rate of new job creation has not yet translated into higher rates of unemployment. But should the economy continue to experience a decelerating rate of growth, those losing jobs will end up becoming unemployed and the rate of growth in wages will lessen.

Ok. The end of June is the end of the month, end of the quarter and end of the first half of the year so lots of numbers. So far this year it’s been up to the equity part of the portfolio to do all of the heavy lifting of creating positive portfolio returns. Year to date the 60% of the portfolio that is invested in equities has returned 13 1/2% but with portfolio returns over that time returning +7% the 40% fixed income share has contributed -3% as stubbornly persistent and elevated interest rates remain that way. June contributed 6% or just under half of equities’ year to date returns. The great majority of the second quarter’s earnings were earned in June and roughly equal shares of those 7% portfolio returns were earned in both the 1st and 2nd quarters.

Mark H. Tekamp/July 8, 2023

Deflation Nation

No, time, thou shall not boast that I do change;

They are but dressings of a former sight – William Shakespeare, Sonnet 123

Many investors spent much of the month of May focused upon the negotiations in Washington DC on raising the debt ceiling of the federal government. Others chose to be enthused over Nvidia’s announcement of May 24th that the company was raising the estimate for its second quarter revenue from $7 to $11 billion leading to a torrent of prophecies of the coming Artificial Intelligence (AI) “revolution”. With that competition for investor’s attention the Bureau of Labor Statistics (BLS) release at 8:30 am on May 10th of the April Consumer Price Index detailing a rise of 0.4% for the month and 4.9% increase year over year passed relatively unnoticed. The number itself was as expected and failed to elicit much of a response from the stock market. Peeling back the various layers of the data though, it is becoming possible to discern that by the end of the year there may be a seismic shift in the Fed’s focus from that of prices rising too quickly to that of their actual descent.

The data the BLS uses to calculate the rise of used car prices and rents are several months old. We know that using more current numbers those prices are now falling and setting them at 0% in April would have given us a CPI number of -0.1%.  Producer Prices measure the prices that domestic goods and services producers receive; the “input” side of the US economy. Those prices rose 0.2% for the month and 2.3% year over year with actual declines in the prices of food, construction costs and transportation along with airfares, hotels and sporting events. The list of commodities trading at prices double digits below their peak levels of the past two years is a lengthy one and includes copper at -20%, coffee -28% lumber -78% and eggs at -82%.

Reasons for the onset of falling prices should be understandable for even a casual observer of the economy. Borrowing’s effect upon the economy is the opposite of that of saving as borrowing draws into the present what would otherwise have been higher future levels of demand. In the 32 years from 1990 through 2022 debt in the United States grew at a rate approximately 50% faster than its economy resulting in debt service representing an increasing claim upon the nation’s economic output and the declining rates of economic growth we are now experiencing. The result is an economy that becomes increasingly sensitive to the level of interest rates and thus more prone to the risk of falling prices as demand grows more slowly than supply. The effects of the $5 trillion spent by the US federal government to offset the economic effects of the pandemic are starting to disappear and M2 money, which had been rising at 27% in early 2021, is now showing an outright decline.

It may be wise for investors to begin to prepare themselves for the possibility of the federal reserve beginning to lower interest rates much sooner than the financial markets currently believe likely, creating the opportunity of taking advantage of a future that is only now becoming visible. Investors now crowding into money market funds yielding 4% and one-year certificates of deposit at 5% should entertain the possibility that rates in the not-too-distant future will make those only fond memories. Bonds which created equity bear market type negative returns in 2022 could be sources of equity market type capital gains. Utility stocks which have declined almost 8% year to date may find their 3% to 4% dividend yields once again an object of investor affection. High dividend stocks whose returns have underperformed S&P 500 by 10% year to date may return to favor.

Perhaps what investors should view as one of their most valuable assets is perspective. Debt is the overwhelming reality of our existence. Artificial Intelligence, debt ceiling talks and federal reserve meetings may serve as welcome sources of distraction but at the end of this day, and for a great many to follow, it’s likely that we find ourselves returning to the pre-pandemic world and this is an outcome that quite possibly we should welcome. The S&P 500 returned an average of 13.6% in the ten years preceding year end 2019. Simple logic should teach us that if the sources creating our current state of reality haven’t truly changed then perhaps the reality we should anticipate lies not too far distant in the past.

May delivered 60 Equity/40 Fixed Income & Cash investors a -1% return for the month and +2.5% year to date as a small rise in interest rates created -1/2% returns for bonds and just over -1% for equities. The change in the May equity market was notable as eight of the eleven sectors of the S&P 500 experienced negative returns with Technologies 9 ½% positive return once again being the notable outlier. Foreign developed markets were -3.7% headlined by Europe’s -5.7% pullback. Returns outside the US are likely explained by rising concerns about the continuing strength of China’s economic recovery.

Mark H. Tekamp/June 6, 2023 

Indices Mysteries

With no one to steer the course, a ship is like an unbridled horse.
Any system will rot to naught without a leader at the helm to direct
Valsa George “Captaincy”

Where is Jerome Powell? An inflation number was reported last week. Who cares? The Federal Reserve is meeting next week, and they may vote to raise interest rates further. Ho hmm. We were supposed to have had a banking crisis six weeks ago and since then the esteemed chairman seems to have gone missing. Certainly, things seem to have gone silent. The stock market couldn’t even make it to the front page of the Wall Street Journal’s April 28th edition having to settle for page B1 with the rather insipid headline “U.S. Stocks Advance for Two Months In a Row”. Insipid but nonetheless true as the S&P 500 rose 1.6% for the month making a new high for the year with a return of 9.2% for 2023 to date. Perhaps more than any year in recent memory though this is a market that is confoundingly difficult to measure with the Dow Jones Industrial Average rising 2.5% but the Nasdaq Composite barely positive with a return of only 1/10 %.

Temperature is measured by Fahrenheit or Celsius and distance by English or Metric systems, but the tools used to measure stock market performance are much more varied and potentially more confusing. For much of the past one-hundred years the Dow Jones Industrial Average was the preferred measure of US stock market returns but in the past several decades it has been superseded by the S&P 500 which is a “basket” of stocks actually numbering 503. Each of those individual stocks weighting in the index is based upon the current value of that company’s publicly traded shares, commonly referred to as capitalization, with the largest company in the index, currently Apple at 7.25%, and the smallest First Republic Bank at 1/300 of 1%, meaning that a price movement in Apple has 2,227 times the effect upon the S&P 500 than does First Republic Bank. The three most commonly used categories of stock market capitalization are large-cap, companies with a capitalization of $10 billion or more, mid-cap with companies between $2 billion and $10 billion and small-cap, companies from $300 million up to $2 billion. The shares of those three as a percentage of the total US stock market are 70%, 20% and 10% respectively. Note that the S&P 500 is composed of 84% large-cap and 16% mid-cap so as an index it modestly underweights mid-cap stocks and excludes small-cap stocks entirely.

The reason for taking this detour into the somewhat technical is that it leads to a rather large point which is that the indices we use to measure stock market returns are currently giving extremely varied rates of return and thus make it difficult to answer a seemingly simple question, “how is the stock market doing” and, more specifically, those indices became particularly confusing at two specific times, the release of an extremely surprising and positive employment number in early February leading to concerns about the likelihood of further fed interest rate increases and the “banking crisis” in mid-March. Examples abound but we’ll satisfy ourselves with the sharing of a modest number. A different variation of the S&P 500 is an equal cap weighted version with each stock in the index having an equal influence on its resulting value. From the start of the year through March 3rd the “normal” S&P 500 was +5.69% and the “equal weighted” version +5.56%. From that date through the end of April the returns are +3.29% and -2.74%. In the first paragraph the variances in the returns of the S&P 500, the Dow Jones Industrial Average and the Nasdaq Composite were noted. Year to date through month’s end those returns are 9.2%, 3.5% and 17.1%. Commonly used indices used to measure small-cap and mid-cap stock performance are the S&P 600 and the S&P 400 respectively. On February 2nd those indices were significantly outperforming the S&P 500 with returns of 13.8% for the 600, 12.3% for the 400 and 9% for the 500. From that date through April those returns are -12% for the 600, -7.6% for the 400 and -1.1% for the 500.

The variances in stock market returns also manifest themselves in the returns between different sectors of foreign markets and the US market as well. An index used to measure the performance of foreign developed markets (Japan, England, France, Switzerland, Germany etc.) is the MSCI EAFE. On January 19th EAFE was outperforming the S&P 500 by 5%. On February 6th those returns were virtually identical. On March 10th EAFE was again outperforming by 5%. On March 21st they were the same. As of the end of April EAFE is outperforming by 2.6%. German, French, Spanish and Italian stock markets are positive through April between 17.6% and 19.2% with French stocks outperforming the S&P 500 by 10%. China’s stock market was up 17.2% on January 27th, 11% more than the S&P 500%. Since that date through April China’s down 15.3% with the S&P 500 +3%. So, there we have it. If we knew what it all meant it wouldn’t be a mystery but it is and so we don’t. Though shrouded in mystery, our wager is still on the bullish side.

For 60 (equity)/40 (fixed income & cash) April was a walk on the mild side with the equity share +1.8% and the fixed income & cash returning -1% due to a modest rise in interest rates resulting in a +.40% for the month and approximately 3% year to date. For three months portfolios have acted like a teeter totter with moderate ups and downs leaving returns close to neutral.

Mark H. Tekamp/May 5, 2023

Going Without the Knowing

Every piece has a place that determines where you start
If a piece is missing from where the parts should meet
It distorts the whole picture and the puzzle can’t be complete – Anonymous

For investors focused primarily upon the behavior of the financial markets the first quarter seemed to offer a relatively normal recovery from a difficult 2022. Both bonds and stocks rose in value, so it wasn’t difficult to feel a sense of relief as last year’s 15% losses for 60/40 stock bond investors provided the welcome relief of 3 ¼ % profits. The onset of the new year offered the hope of something a bit better than that though as January represented close to the entirety of the quarter’s gains with February drawing down some portion of those profits and March restoring the greater amount of them with the S&P 500 rising 7.50% for the quarter and 3.7% for the month. The fixed income markets mirrored the equity markets by rising in January, falling in February and rising again in March. While a cursory glance of the equity markets might not reveal much in the way of the dramatic, a closer examination of the market exposes something a great deal more interesting.

The first hint of something interesting lying beneath the surface of the returns of the indices is by observing the dramatic variance in the returns of the indices themselves. The Dow Jones Industrial Average was up less than 1% but the Nasdaq Composite was up 17%. Of the eleven sectors of the S&P four, Utilities, Health Care, Energy and Financials, were negative. Three, Information Technology, Communication Services and Consumer Discretionary, were positive by double digits. Digging a bit deeper still one would discover that Information Technologies’ 21.6% return and its two largest companies, Microsoft and Apple, with a combined weighting of 44% of that sector and whose returns of 20% and 27%, representing 48% of that sector’s return, aren’t very far distant from one another. The truth that the stock market is back to riding on the returns of the “mega cap” technology companies is revealed by investigating the returns of the other two sectors. Second place Communication Services is dominated by the 38% weighting of Meta (Face Book) and Alphabet (Google) with respective returns for the quarter of those two companies of 76% and 17 ½%, explaining 76% of that sector’s return of 21%. Third place Consumer Cyclicals’ combined weighting in Amazon and Tesla is 34% and with returns of 23% and 68%, are responsible for 78% of that sector’s performance of 16%. So, we’re left confronting the reality of an entire index being dominated by the performance of six companies, representing 19% of the capitalization of the index, providing 69% of the S&P 500’s 7 ½% return for the quarter.

The onset of April brings showers, but it has also brought investors the welcome relief of the prospect of a Fed declaring victory over inflation and ending its rate rising cycle. In a world where debt is three times the size of the global economy, we’re well past the point of paying down the debt so we’re left with the need to refinance it by borrowing new money to issue new debt to replace the “old” debt as it matures. For the “treadmill” to continue to turn over the world depends upon the availability of collateral; the requirement for an asset to support the existence of the loan. The availability of that collateral is referred to as liquidity and since 2022, central banks, ostensibly concerned about levels of inflation, have caused global liquidity conditions to be a receding tide, leading to the inevitability of something in the global financial system breaking and indeed, the likely cause of the market declines in 2022. The current inverted yield curve, in which longer maturity securities pay lower rates of interest than those of shorter maturities, is an indicator of a lack of system liquidity. In March we had two banks in the United States requiring support to avoid the possibility of a larger problem in the banking system. Interestingly though, the onset of “the banking crisis” led to a recovery in the stock market as the S&P, whose year to date return had fallen to less than 1% on March 13th, added 6 ½% to that number by month’s end.

The future would now seem to be able to be seen with a bit more clarity. Until mid-month investors were caught up in a confusing mix of good economic news being bad financial market news due to the belief that the Fed wanted slower rates of economic growth in its quest for a lower rate of inflation. While the Fed denied that its response to “the banking crisis” at mid-month represented any sort of retreat from its policy, the reality of its response is likely to be characterized by a restoration of the pro-liquidity actions of its policy from the onset of the pandemic in early 2020 through 2021, as demonstrated by a dramatic narrowing of the yield spread between two year and ten year treasury rates from nearly 1% at the onset of the month to close to ½% at the month’s end. So, if we’re back to inhabiting a world in which good economic news is also good financial market news what should investors expect over the next several months?

The reality of a world characterized by very high levels of debt means that the provision of an adequate level of liquidity is the single most important determinant of the outlook for the stock market. As its insufficiency explains the negative returns delivered by the 2022 stock market, so is its restoration likely to be the source of the positive returns experienced by investors in 2023. Remember, debt is a global and not just a domestic phenomenon and with global capital flows of $170 TRILLION and the value of the US stock market $44 trillion a 5% change in the former represents a 20% change in the latter.

Mark H. Tekamp; April 10, 2023